
Data dashboard detail pages
The detail pages of your dashboard show you how people interacted with a specific piece of content in your guide. For example, you can open the detail page for a specific Exhibition to see which of the Exhibition's Items had the most unique views.
Note: To get back to the main landing page from any detail page, use your browser's Back button.

Detail page tiles
Users by day
A line chart showing the number of people who interacted with your content each day during the date range.
A person is counted as a "user" regardless of how they found a piece of content. They can find your content in a number of different ways, including: scanning a lookup QR code, finding content on your map, and finding content on your home screen.
Repeat visitors are only counted once per day.
If your user count for today looks low, keep in mind that data is reported on a delay (up to 24 hours). Check back tomorrow for the updated data.
Actions
To see how many people interacted with your content each hour in a given day, click any point on the line chart and select Drill into [Date] by Date Hour.
A person who views a piece of content several times in one day is counted once on the main line chart, but several times on the by-hour screen. A person who views a piece of content several times in one hour is counted just once for that hour.
Users
The total number of people who interacted with your content during the date range.
A person can find your content in a number of different ways, including: scanning a lookup QR code, finding content on your map, and finding content on your home screen. A person is counted as a "user" regardless of how they found a piece of content.
Note: The number of users shown on a detail page might not match the number of unique views in the content tile on the main landing page. This is because one user might be counted as more than one unique view.
Languages
The number of people who accessed your content in each language, both as a count and as a percentage of all guide users.
Exhibitions Items/Tour Stops
(Available for Exhibitions and Tours only)
The number of people who interacted with each Item (or Stop) inside the parent Exhibition or Tour, represented by unique views.
Actions
For more on how people engaged with each Item, click an Item title and select See Item Details.
Related content
The number of people who interacted with each piece of related content, represented by unique views.
Sources
A breakdown of the unique views based on how people discovered the content. Depending on how you've structured your guide, you may see any of the following:
- Home Page
- Map
- Lookup Number
- Lookup QR Code
- Exhibition
- Tour
- Item
Audio
The number of people who listened to each attached audio file, represented by unique plays, and the average duration of the plays.
For Exhibitions and Tours, the list of audio files includes the files attached to the Exhibition/Tour itself and the files attached to child Items.
Video
The number of people who played each attached video, represented by unique plays, and the average duration of the plays.
For Exhibitions and Tours, the list of video files includes the files attached to the Exhibition/Tour itself and the files attached to child Items.
Change content on a detail page
On any detail page, you can quickly switch to another piece of content of the same type. For example, if you are on the exhibition detail screen for the Key Works in the Thannhauser Collection Exhibition at the Guggenheim Museum, you can switch to the detail screen for the Jenny Holzer: Light Line Exhibition.
Steps
-
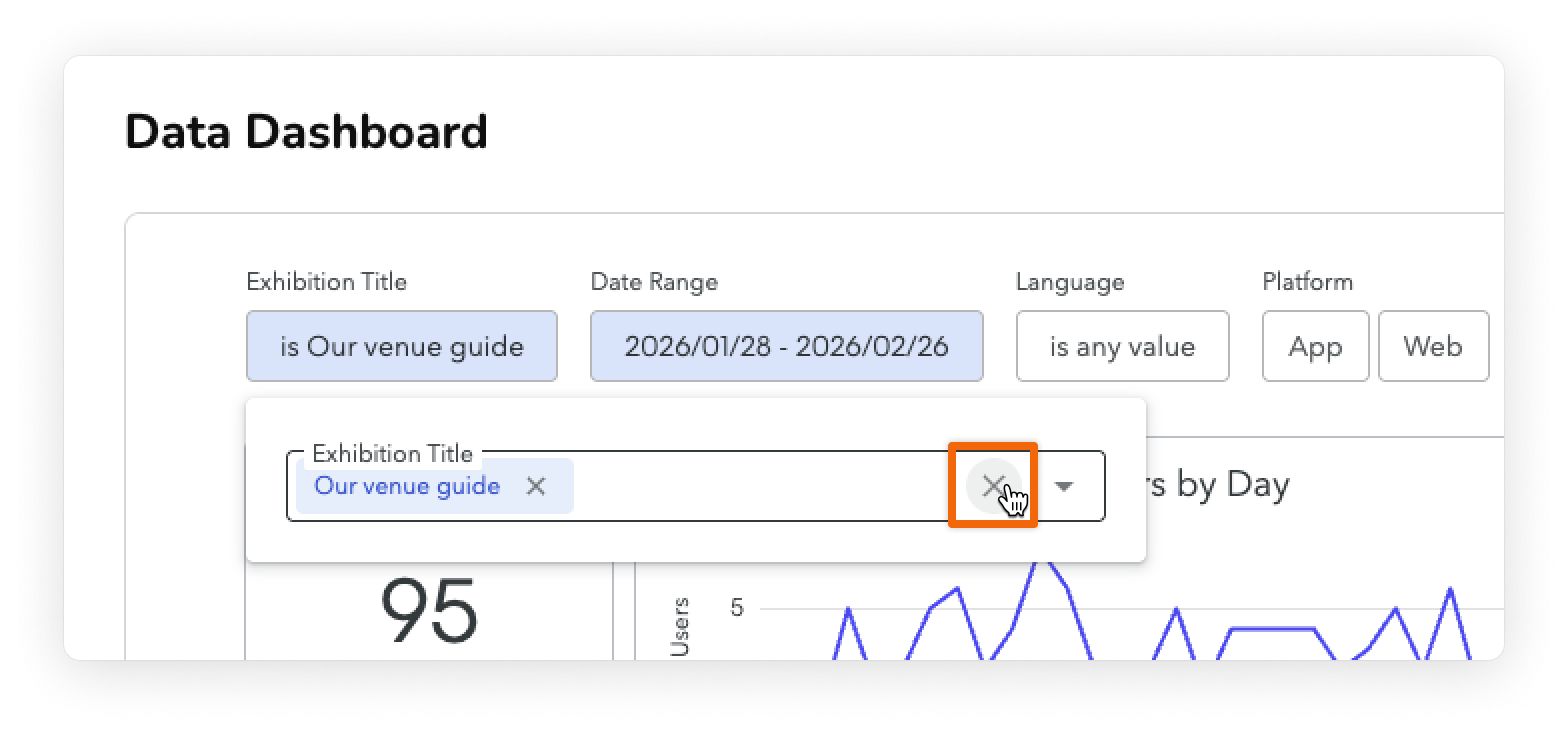
Click into the [Content] Title field, then click the Clear Field button.
-
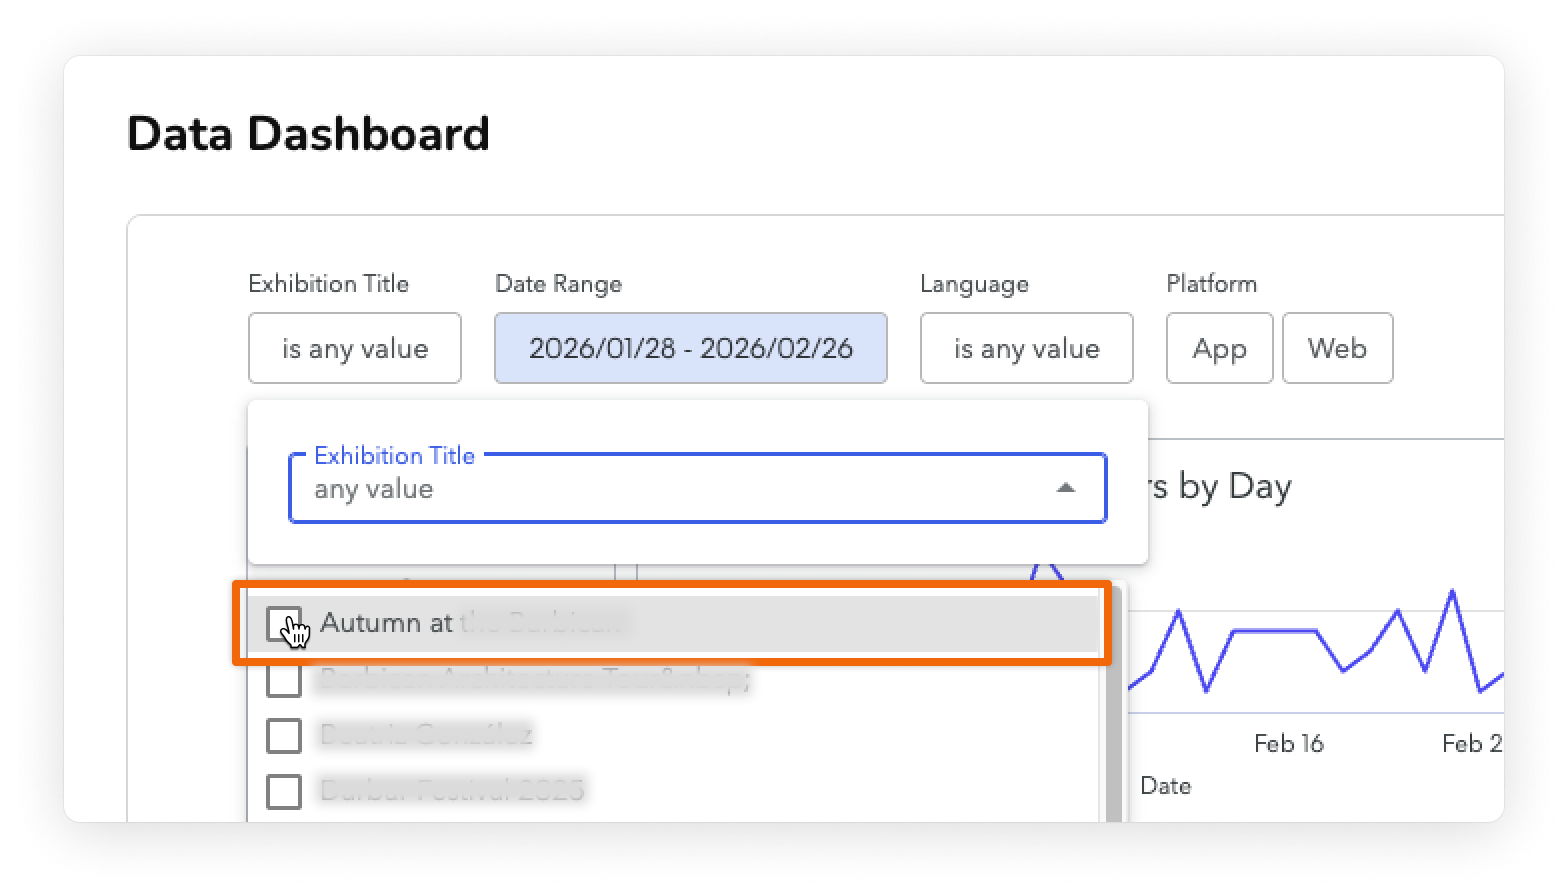
Click the dropdown arrow, then, from the list that appears, select one or more pieces of content.
-
Click the Update button.


The dashboard refreshes with data for your selected content. If you selected more than one piece of content, the data is aggregated.